You can generate your report while having a specific file open in your webapp, or you can generate the report from the file overview.
Generate report from file
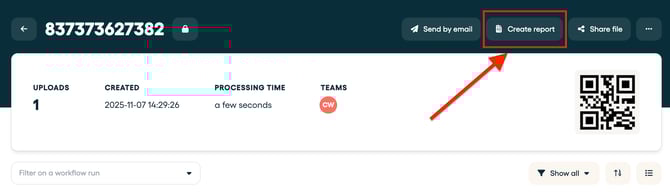
Within the file itself, it is possible to create a report of said file. To do so, click on the 'Create report' button :
Generate report from file overview
Navigate to the Files page overview and select the File Reference that you need in your report. You can select multiple files, depending on what you need your report to contain.

Navigate then to 'With selected' and click 'Create report'.
Note: You can only generate a PDF report with a maximum of 10 files.
Where is your download stored?
Once you clicked 'Create report' (in a file or in the file overview), the report will be downloaded in the report overview. From there, you can download your report by selecting the download button.
Note: The reports overview page displays the reports created in the last 30 days.

And there you go, you now have generated a report in PDF that you can store or share with other people.
Example:

Why are my reports sometimes not being downloaded?
When generating and downloading a report is not possible, it could mean that your file contains too much data for the report engine. In that case, please reach out to our support channel and ask us to (temporarily) enable the option to download the report in your web browser instead.
Sharing and analyzing data
Are you looking for a faster way to share your file with others? You could use the Share File feature, which gives the receiver access to the specific file on the platform, including options to filter and sort the data, as well as changing the view (list or grid).
Do you want to go a step further in analyzing your data? You might want to extract your data with our API. Connect it to Power BI and create powerful visual reports to get in-depth insights into your operations!
💡 Note: Cargosnap does not support custom layouts at the moment. However, you can change your company logo (see article) and by using the filter options you can exclude parts of your file record in a PDF report. More information in this article:
Navigating your file: filters and organization